
Brussels, 10 June 2026
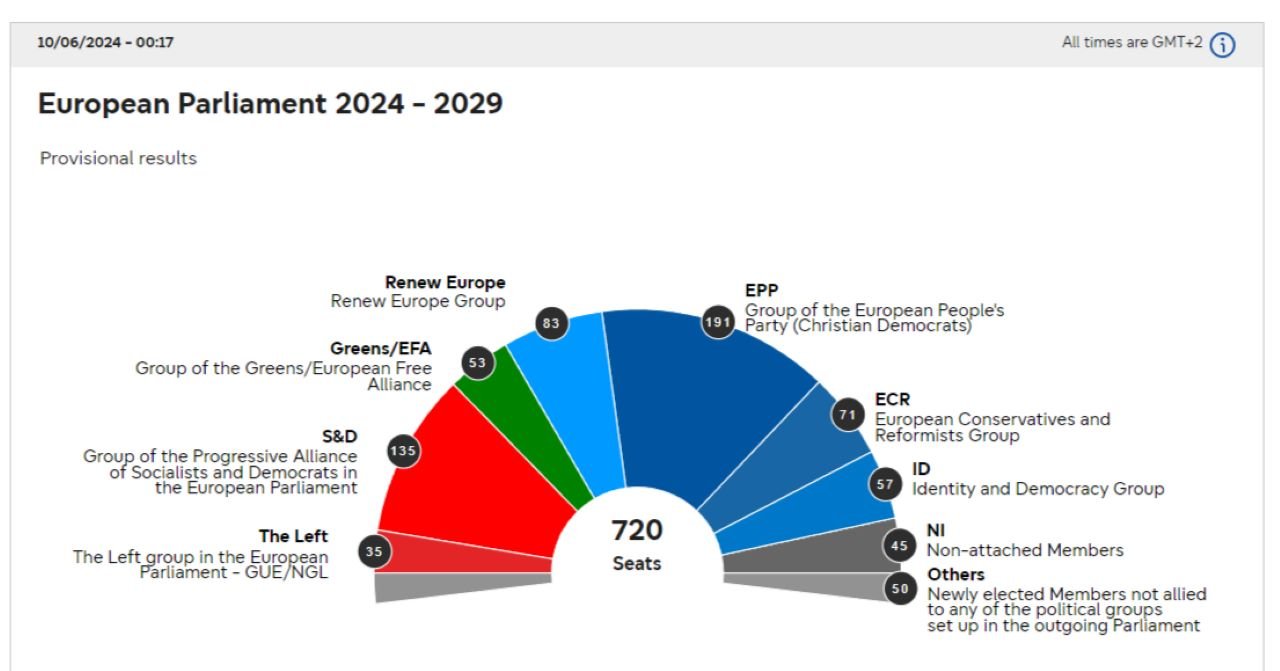
Th provisional Composition of the European Parliament based on available provisional or final national results published after voting has finished in all Member States, based on the structure of the outgoing Parliament. According to Parliament’s rules of procedure, a political group shall consist of at least 23 Members elected in at least seven Member States.
| Political groups in the EU Parliament | Seats | % |
|---|---|---|
| 191 | 26.53% | |
| 135 | 18.75% | |
| 83 | 11.53% | |
| 71 | 9.86% | |
| 57 | 7.92% | |
| 53 | 7.36% | |
| 35 | 4.86% | |
| 45 | 6.25% | |
| 50 | 6.94% |