Luxembourg, 4 October 2024
In 2023, the EU imported €478 billion worth of high-tech products, a slight decrease compared with 2022 (-1%). At the same time, exports reached €461 billion (+3% compared with 2022).
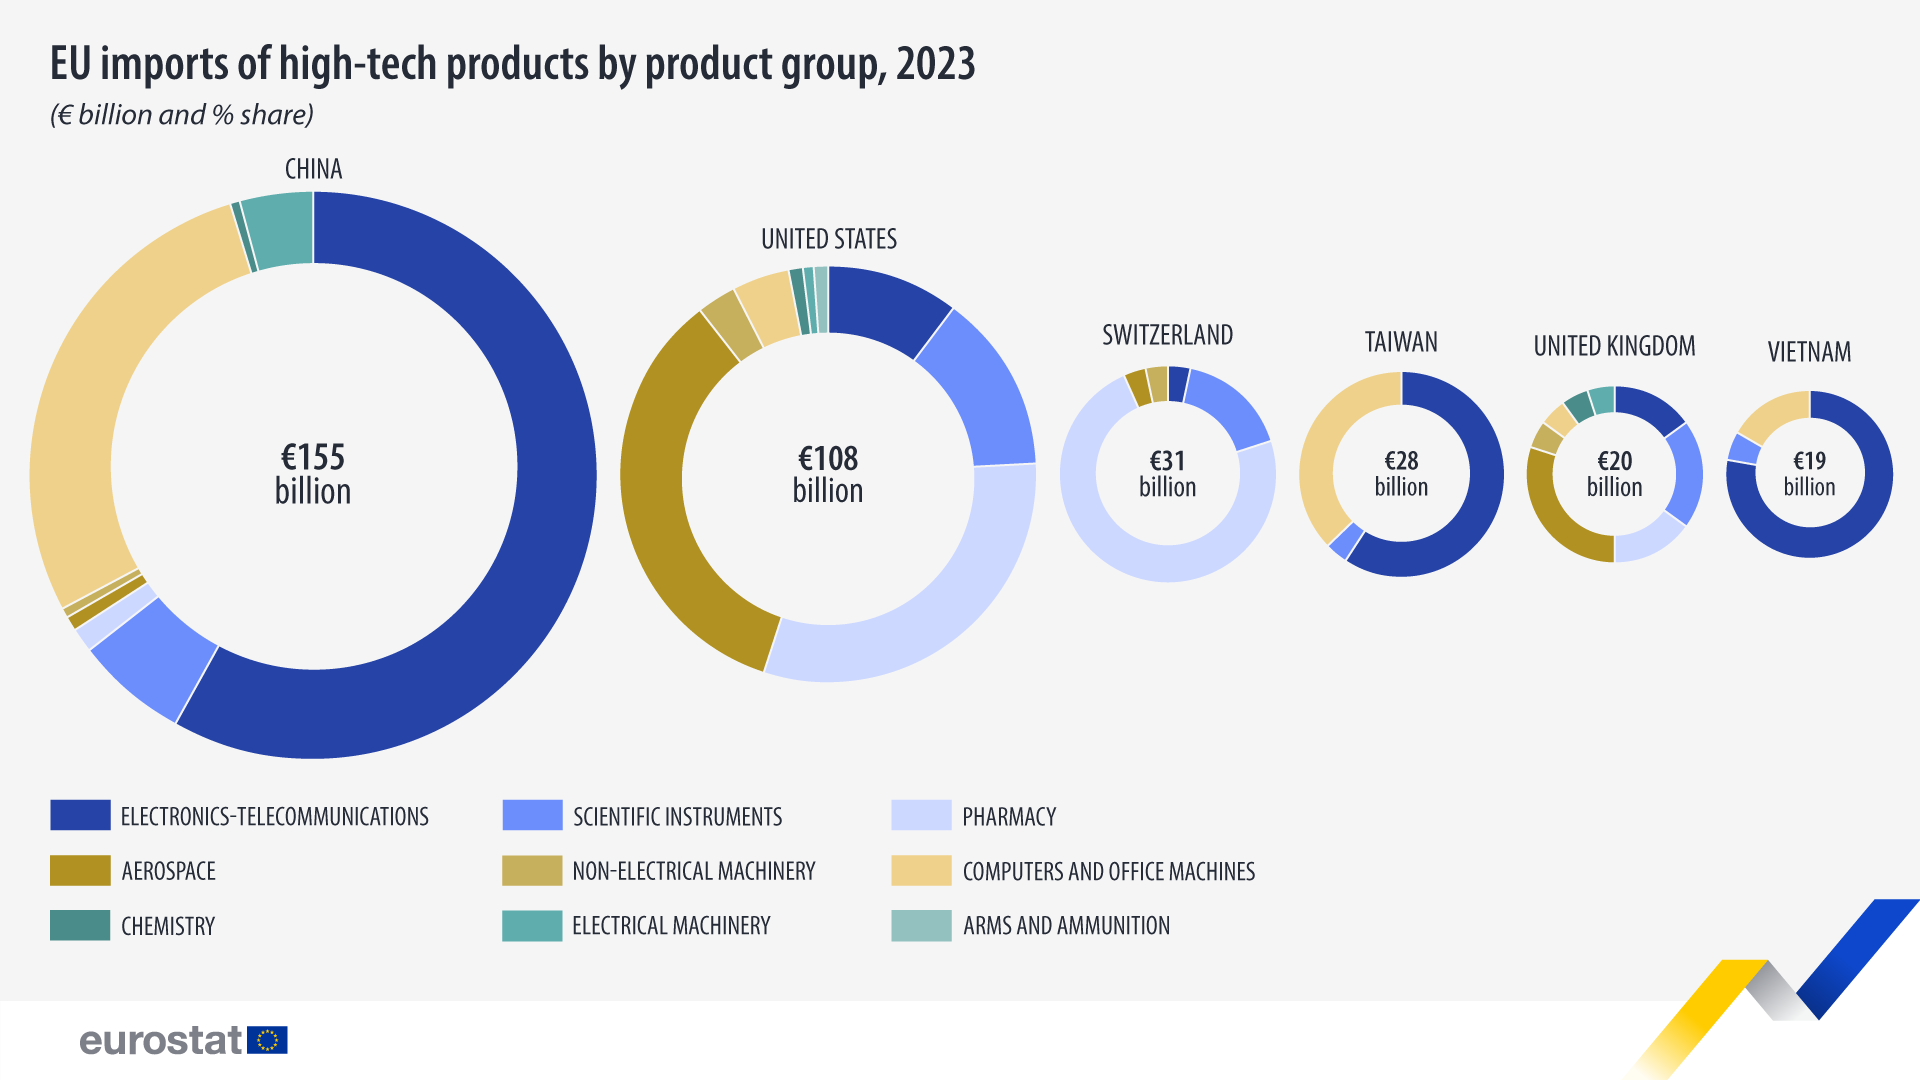
Over half of the EU’s high-tech imports in 2023 came from China (32%; €155 billion) and the United States (23%; €108 billion), with other top partners being Switzerland (7%; €31 billion), Taiwan (6%; €28 billion) and the United Kingdom and Vietnam (each 4%; €20 and €19 billion respectively).
Electronics-telecommunications accounted for the largest share of high-tech imports from non-EU countries (39%), for which China was the largest partner. Computers and office machines as well as pharmacy both accounted for 15% of high-tech imports, most of which came from China and the United States respectively.
Source dataset: DS-018995; Eurostat extraction
Electronics-telecommunications made up the largest share of imports from Vietnam (73% of high-tech imports from Vietnam; €14 billion), Taiwan and China (each 58%; €16 billion and €89 billion, respectively).
For Switzerland, the largest category was pharmacy (70% of high-tech imports from Switzerland; €22 billion).
For the United States (35%; €37 billion) and the United Kingdom (30%; €6 billion), it was aerospace.
Pharmacy comprised 30% of high-tech exports
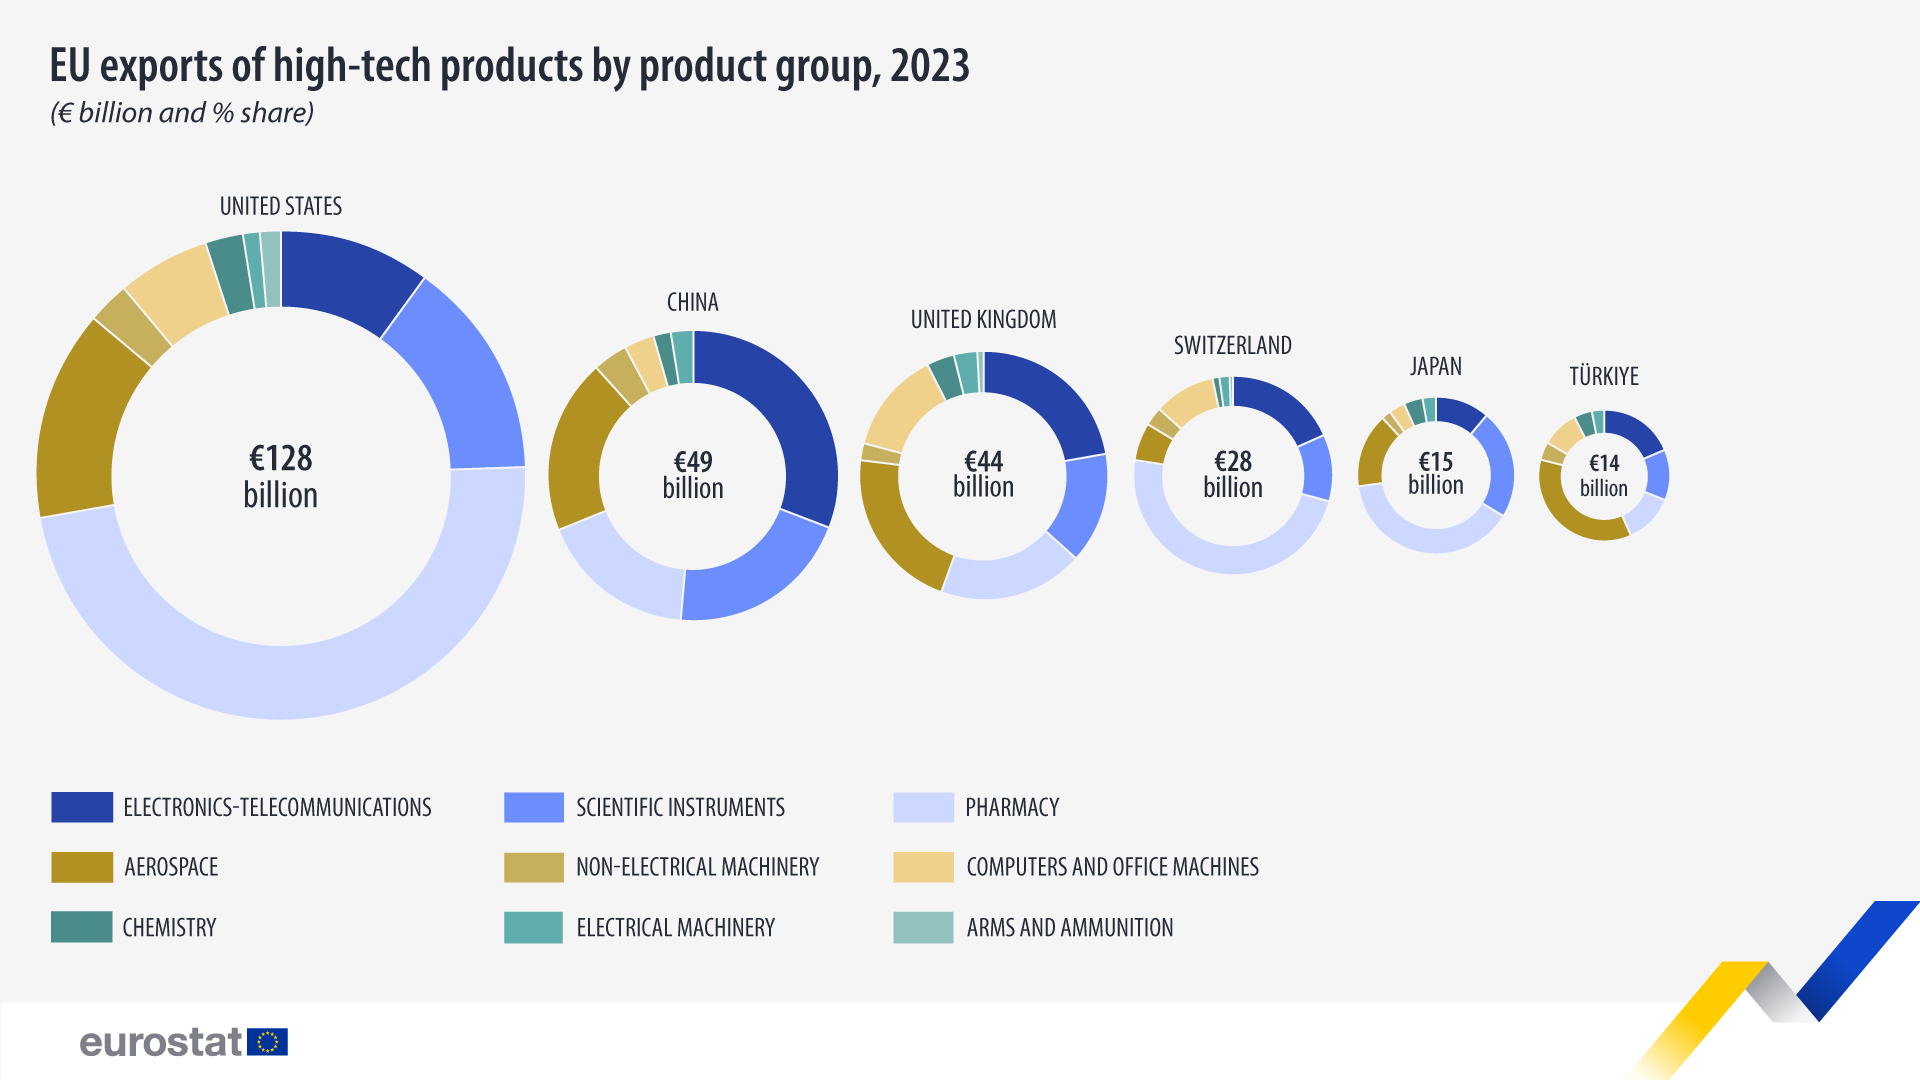
In 2023, the United States was the top trading partner (28%; €128 billion) for high-tech exports to non-EU countries. China followed (11%; €49 billion), ahead of the United Kingdom (10%; €44 billion), Switzerland (6%; €28 billion), Japan and Türkiye (each 3%; €15 billion and €14 billion, respectively).
Pharmacy made up the largest share (30%) of overall high-tech exports to non-EU countries, with the United States being the top partner. Electronics-telecommunications (20%) and aerospace (18%) followed, with China and the United States as the leading partners in these sectors respectively.
Source dataset: DS-018995; Eurostat extraction
Pharmacy was the largest exported category for Switzerland, the United States (both 48% of high-tech exports; €14 billion and €61 billion, respectively), and Japan (39%; €6 billion).
The largest category for China (31% of high-tech exports to China; €15 billion) and the United Kingdom (22%; €10 billion) was electronics-telecommunications. For Türkiye, it was aerospace (35%; €5 billion).
More information
- Statistics Explained article on international trade and production of high-tech products
- Thematic section on international trade in goods
- Database on international trade in goods
- Statistics 4 Beginners on trade
Methodological notes
The data in this article uses the high-tech aggregation by SITC Rev. 4. This list, based on the Organisation for Economic Co-operation and Development (OECD) definition, contains technical products of which the manufacturing involved a high intensity of R & D.
Source – Eurostat


